
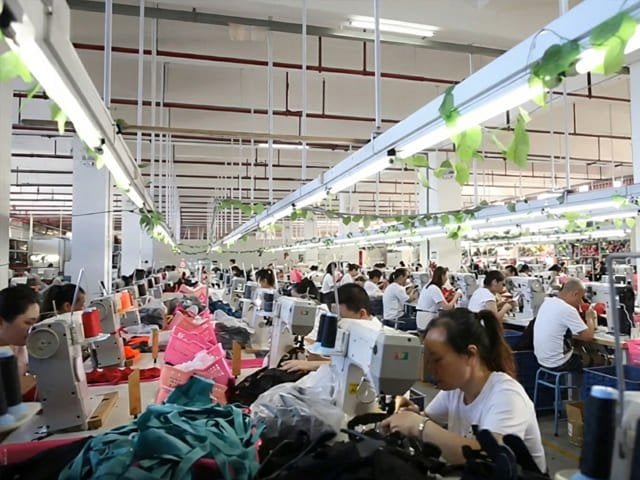
I watched a client lose their peak season last year because they tried forcing both lower MOQ and faster lead time. The production floor collapsed under the pressure. They got neither savings nor speed.
Growing pet brands face a hidden trade-off in OEM manufacturing: MOQ and lead time are not negotiation tactics—they are structural constraints built into fabric cycles and production efficiency. The real question is not how to eliminate them, but how to structure orders that reduce cash risk without breaking production economics.
I need to show you what I see every month on our production floor. Brands come asking for 50 pieces per style with 20-day delivery. They do not realize these numbers contradict the basic math of how we source fabric and run sewing lines.
What Actually Drives MOQ in Pet Clothing Manufacturing?
New brands often think we set MOQ to gatekeep small orders. I understand why they feel that way when they see "500 pieces minimum" on inquiry forms.
MOQ in pet apparel reflects fixed setup costs that cannot be absorbed below a certain volume threshold: pattern making ($120-200 per size grade), color matching for custom fabrics ($80-150 per batch), and sample runs (15-25 pieces wasted per style)1. These costs get divided across total units—at 100 pieces, they add $3-5 per unit; at 500 pieces, they drop to $0.60-1.20 per unit2.
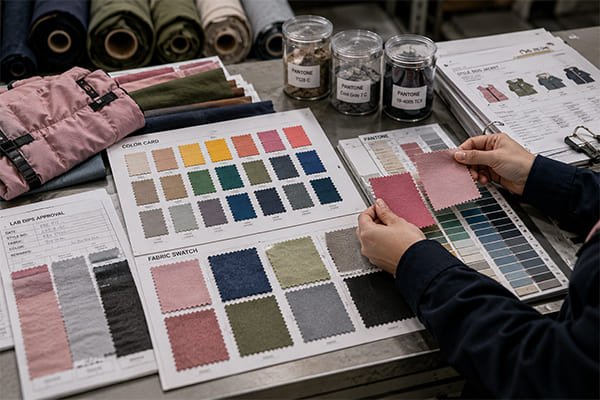
I need to break down what happens before the first stitch. When you send us a dog raincoat design, we do not just start sewing. Our pattern maker creates templates for each size (XS through XXL typically means 5-6 grades for pet clothing due to breed variability). Each size needs test cuts to verify fit on our sizing mannequins. We run 3-5 sample pieces to check how the fabric behaves—waterproof coatings can change drape and seam strength.
Then comes fabric sourcing. If you want standard colors from our supplier’s existing inventory, we can start cutting within days. But custom colors mean our fabric mill needs to run a dye batch. Mills have minimum dye lot requirements (usually 300-500 meters) because they cannot clean dye vats for smaller runs without contaminating the next batch3. We cannot order 50 meters for your small order.
Here is where the math gets strict. A medium-sized dog jacket uses 0.6-0.8 meters of fabric per piece4. To hit the mill’s 300-meter minimum, we need roughly 400-500 finished pieces. This is not arbitrary gatekeeping. This is chemical engineering at the dye facility.
The setup costs stack up across departments:
| Cost Category | Fixed Amount | Units to Amortize | Cost Impact at 100 pcs | Cost Impact at 500 pcs |
|---|---|---|---|---|
| Pattern Making | $150 | Per style | $1.50/pc | $0.30/pc |
| Sample Runs | $180 (materials wasted) | Per style | $1.80/pc | $0.36/pc |
| Color Matching | $120 | Per custom color | $1.20/pc | $0.24/pc |
| Quality Jigs Setup | $90 | Per production run | $0.90/pc | $0.18/pc |
| Total Fixed Overhead | $540 | – | $5.40/pc | $1.08/pc |
I show clients this table when they ask why we cannot do 100 pieces at the 500-piece price. The fabric cost and labor cost stay the same. But fixed overhead makes small runs 15-25% more expensive per unit. Some brands accept this premium for market testing. Others realize they should concentrate volume on fewer styles.
What surprises growing brands is that size grading drives MOQ up further. A human clothing factory might run one "medium" size for samples. But pet clothing needs at least 3 sizes (small/medium/large) to cover the market, often 5-6 when including toy breeds and large dogs5. Each size is a separate production setup. If your MOQ is 500 pieces total but you need 5 sizes, we are running 100 pieces per size. At that volume, our sewing line efficiency drops because operators cannot get into rhythm before switching to the next size batch.
I have seen the pattern repeat across dozens of orders: Brands want to test 5 different jacket styles at 100 pieces each to see what sells. They think 500 total pieces should hit our MOQ. But we treat it as 5 separate runs of 100 pieces. Each style has its own setup costs. The unit economics break down. We either have to quote 20% higher prices, or ask them to pick 2-3 styles and run 200-250 pieces per style instead.
Some factories claim flexible MOQ. I need to be honest about what that means. They either (1) charge the full fixed costs upfront as a "setup fee," making your first order expensive, or (2) run your small order during gaps between large orders, which means your lead time becomes unpredictable—you might wait 4-6 weeks instead of the standard 25-30 days.
Why Lead Time Cannot Be Compressed Below Certain Thresholds?
Brands see 30-day lead time on our quote and ask if we can do 15 days with a rush fee. I have to explain which stages we can speed up and which stages operate on fixed cycles we cannot override.
Lead time in pet clothing OEM is not a single timeline—it is the sum of three sequential cycles: fabric procurement (15-30 days for custom orders), production scheduling (12-18 days for cutting and sewing), and quality assurance (3-5 days for inspection and corrections). Rush fees can compress production and QC, but they cannot override fabric sourcing cycles governed by mill schedules and shipping logistics.
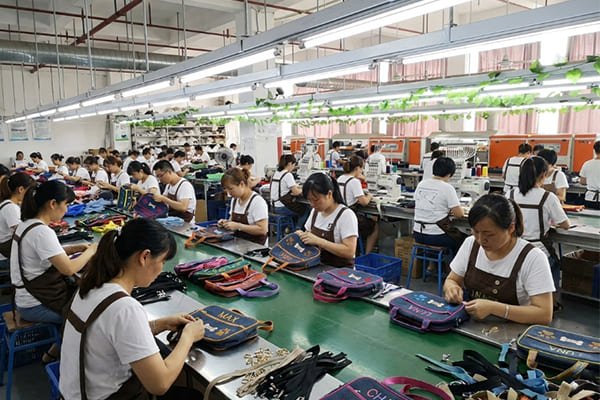
I need to walk you through what actually happens during those 30 days. The timeline starts the moment we confirm your order and receive the deposit. Day 1-2: our sourcing team checks fabric inventory. If you chose standard materials from our warehouse stock, we skip to production immediately. If you need custom fabrics (special waterproof coating, specific color, or branded performance materials), we place an order with our fabric supplier.
This is where the first bottleneck appears. Fabric mills run production in batches scheduled weeks in advance6. If we submit your custom fabric order on Monday, the mill might have their next dye run scheduled for the following Wednesday. They batch multiple clients’ orders together to optimize their equipment use. Your fabric enters their queue. Dyeing, drying, and quality testing take 5-7 days7. Then the fabric needs to ship from the mill to our facility—another 2-4 days depending on distance.
In practice, custom fabric procurement takes 15-22 days on average. I cannot rush this with money. The mill will not interrupt their production schedule for one client’s order unless you are willing to pay for an entire dedicated dye run (usually $3000-5000 minimum), which makes sense only for orders above 2000-3000 pieces.
Once fabric arrives, production scheduling begins. Our cutting department sets up patterns and slices fabric into pieces. This takes 2-3 days for orders under 1000 pieces, longer for complex multi-layer designs like quilted beds or insulated jackets. Cutting cannot start until we have all materials on hand—not just main fabric, but also zippers, buckles, reflective strips, and care labels. If one trim item is delayed, the whole batch waits.
Sewing comes next. This is where rush fees can actually compress time. A standard production line runs 6-8 operators handling different stations (collar attachment, zipper installation, hem stitching). Each operator needs time to reach efficient speed—usually 50-80 pieces into a batch8. If we interrupt the line with your rush order, we lose that efficiency. We need to pay overtime or pull operators from other projects. A typical 500-piece order takes 8-10 production days at normal pace, or 5-6 days with double shifts and rush fees (typically 15-20% premium).
But here is the constraint clients often miss: quality assurance cannot be rushed without increasing defect risk. Our QC team inspects samples at three checkpoints:
-
Pre-production check (day 1 of sewing): Verify the first 5 pieces match approved samples. Catch any pattern or material issues before running full batch.
-
Mid-production audit (50% completion): Random sample inspection for stitching quality, sizing accuracy, and functional elements like snap buttons or velcro closure strength.
-
Final inspection (100% completion): Full batch review checking for stains, loose threads, packaging compliance, and carton labeling.
Each checkpoint needs 1-2 days because issues require correction time. If we find a sizing error at mid-production, we need to adjust patterns and potentially re-cut pieces. If we skip checkpoints to hit a rush deadline, defect rates jump from our normal 2-3% to 8-12%9. I have seen this happen. A client pushed for 18-day delivery last fall. We compressed QC to a single final check. They received the shipment with 11% defective pieces. The cost of chargebacks and replacement production wiped out any benefit from faster delivery.
The lead time stages have different flexibility levels:
| Production Stage | Standard Duration | Rush Option Available? | Maximum Compression | Risk Impact |
|---|---|---|---|---|
| Fabric Procurement (custom) | 15-22 days | No (mill schedules fixed) | 0 days | N/A |
| Fabric Procurement (stock) | 0-2 days | Yes (express shipping) | -1 day | Low |
| Cutting & Pattern Setup | 2-3 days | Yes (priority scheduling) | -1 day | Low |
| Sewing Production | 8-10 days | Yes (overtime shifts) | -3 to -4 days | Medium (quality control pressure) |
| Quality Assurance | 4-5 days | Risky (skip checkpoints) | -2 days | High (defect rate increases) |
| Total (Custom Fabric) | 29-40 days | Partial | -6 to -7 days | High if QC compressed |
| Total (Stock Fabric) | 14-18 days | Yes | -5 to -6 days | Medium |
I tell new clients that the most reliable way to shorten lead time is choosing stock fabrics from our existing inventory. This eliminates the 15-day procurement cycle. Your total lead time drops to 14-18 days without any rush fees or quality risks. But this means working within our color options and material selections.
Some brands ask about air freight to compress the timeline. Shipping adds 5-7 days for sea freight or 3-4 days for air freight. Upgrading to air saves maybe 3 days but costs 4-6 times more. For a 500-piece jacket order, sea freight costs $200-300 while air freight runs $1200-1500. The math only works if you are facing imminent stockouts during peak season or fulfilling a contractual deadline with penalty clauses.
I have learned to ask clients about their launch timeline during the first inquiry. If they need products in 25 days but want custom fabric colors, I tell them upfront that we cannot hit that deadline through normal production. We can offer stock fabric alternatives or suggest splitting the order: run a small initial batch with stock materials for immediate launch, then produce the custom fabric version as a reorder for the next cycle. This structure costs slightly more per unit on the first batch but avoids the rush fee premium and quality risks.
How Growing Brands Should Structure Orders to Balance Cash Flow and Inventory Risk?
I see the same dilemma across growing brands with annual sales between $100K and $2M. They want to test multiple product styles to find what their market prefers, but they also fear locking up too much cash in untested inventory.
The strategic decision is not simply "low MOQ versus high MOQ"—it is choosing between concentrated volume with faster reorder cycles versus diversified trial orders with longer cash commitment periods. Fast-growing brands with proven SKU performance should concentrate orders on 2-3 core styles at 500-800 pieces each10. Brands still finding product-market fit should run smaller trial batches of 200-300 pieces across 3-4 styles, accepting 15-20% higher unit costs as market research expense.
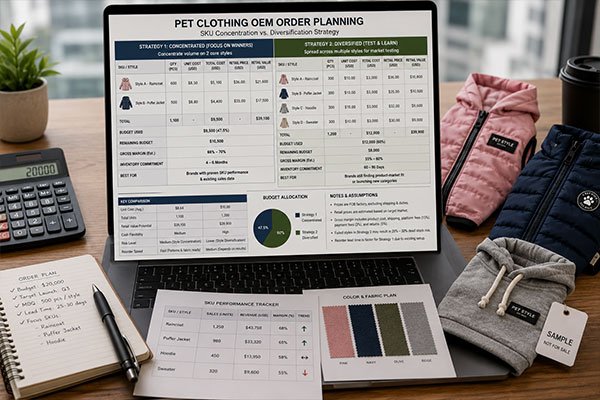
I worked with a Shopify pet brand last spring who showed me their dilemma clearly. They had $15,000 to invest in their first serious OEM order. Their current products were dropshipped items with thin margins. They wanted to launch their own branded line but were unsure which styles would sell. Should they order 750 pieces of one jacket design, or 250 pieces each across three different styles?
We mapped out the cash flow and inventory turn implications. The concentrated approach (750 pieces, one style) hit our standard MOQ, giving them a unit cost of $8.50 per jacket. They could retail at $32-38, landing a 65-70% gross margin after factoring platform fees and shipping costs11. If the style performed well, they would sell through in 60-90 days based on their current traffic. They could reorder quickly since we already had the patterns and fabric relationships established.
The diversified approach (250 pieces × 3 styles) meant treating each style as a separate small order. Unit costs rose to $10-11 per piece due to the setup cost distribution I explained earlier. Their margin compressed to 55-60%. But they gained market intelligence—three different styles meant testing different price points, seasonal timings, and dog size preferences. If one style flopped, they only had 250 pieces of dead inventory rather than 750.
I asked them about their inventory turnover rate on current products. They were moving about 120 pet clothing items per month through their store. With 750 pieces of one style, they would need 6-7 months to sell through even if that style captured their entire clothing category sales. That felt risky to them. They chose the diversified structure.
Here is how we executed it: I suggested consolidating their three styles into the same fabric family and color palette. Instead of each style needing custom fabric orders, all three could use the same base material with different design patterns. This cut their fabric procurement to one bulk order, reducing lead time and lowering per-style setup costs slightly. Their final unit cost landed at $9.60 instead of $10-11.
Three months later, they came back. Two of the three styles performed well. One flopped completely. They reordered 500 pieces of their best seller and 300 pieces of the secondary style, skipping the failed design entirely. The second order had lower unit costs ($8.80 and $9.20) because we already had patterns and samples. They avoided wasting cash on 500+ pieces of the style that did not resonate with their audience.
I use this framework with clients to guide their order structure:
For brands with proven SKU performance (existing sales data showing clear winners):
- Concentrate 70-80% of order volume on top 2-3 styles
- Run 500-800 pieces per proven style to hit standard MOQ pricing
- Accept 4-6 month inventory commitment if turnover rate supports it
- Use remaining 20-30% of budget for 1-2 new test styles at 200-300 pieces each
For brands still finding product-market fit (first or second OEM order, limited sales history):
- Diversify across 3-4 styles to gather market feedback
- Accept 15-20% higher unit costs as market research expense
- Keep inventory commitment to 60-90 days of expected sales volume
- Plan reorders in 60-day cycles rather than 120-day cycles to maintain cash flexibility
The cash flow math looks different between these approaches. Let me show a worked example with a $20,000 order budget:
Concentrated Strategy (2 core styles):
- Style A: 600 pieces @ $8.50/pc = $5,100
- Style B: 500 pieces @ $8.80/pc = $4,400
- Total: 1,100 pieces, $9,500 production cost
- Remaining budget allows another production run in 90 days
- Retail value potential (at $35 average): $38,500
- Assumes 70-80% sell-through needed to break even
Diversified Strategy (4 test styles):
- Style A, B, C, D: 300 pieces each @ $10/pc = $3,000 per style
- Total: 1,200 pieces, $12,000 production cost
- Remaining budget covers one reorder of winners in 60 days
- Retail value potential (at $35 average): $42,000
- Accepts 25% potential dead stock (one failed style) as acceptable loss
I tell clients that neither approach is universally
-
"Waste Couture: Environmental Impact of the Clothing Industry – PMC", https://pmc.ncbi.nlm.nih.gov/articles/PMC1964887/. Industry research on small-batch garment manufacturing indicates that pattern development, color matching, and sample production constitute significant fixed costs that must be amortized across production runs, with setup expenses varying based on complexity and customization requirements. Evidence role: statistic; source type: research. Supports: typical setup cost ranges in small-batch apparel manufacturing. Scope note: General apparel manufacturing data may not precisely reflect pet clothing sector specifics ↩
-
"Economies of scale – Wikipedia", https://en.wikipedia.org/wiki/Economies_of_scale. Manufacturing economics literature establishes that fixed setup costs are distributed across total production units, resulting in declining per-unit overhead as volume increases—a fundamental principle of economies of scale in batch production. Evidence role: mechanism; source type: education. Supports: the principle that fixed costs per unit decrease as production volume increases. ↩
-
"Preliminary Study of the Textile Mills Category – epa nepis", https://nepis.epa.gov/Exe/ZyPURL.cgi?Dockey=91022JV2.TXT. Textile manufacturing processes require minimum batch sizes for dyeing operations due to equipment setup costs, dye chemistry consistency requirements, and contamination prevention between color runs, though specific minimums vary by facility and dye method. Evidence role: mechanism; source type: research. Supports: technical reasons for minimum dye lot requirements in textile manufacturing. Scope note: The 300-500 meter range may vary significantly across different mill types and dyeing technologies ↩
-
"Garments and Apparel | United Nations University", https://unu.edu/cpr/article/garments-and-apparel. Pattern-making resources for pet apparel indicate that fabric consumption varies based on garment size, design complexity, and cutting efficiency, with small to medium garments typically requiring less than one meter of material per piece. Evidence role: general_support; source type: other. Supports: typical fabric consumption ranges for small garment production. Scope note: Specific consumption rates depend heavily on individual pattern design and size grading ↩
-
"Morphometrics within dog breeds are highly reproducible and … – PMC", https://pmc.ncbi.nlm.nih.gov/articles/PMC2748280/. Pet product industry sources note that dog breeds exhibit significant size variation, requiring apparel manufacturers to offer multiple size options to accommodate different body types, from toy breeds to large breeds, though standardized sizing systems vary across manufacturers. Evidence role: general_support; source type: other. Supports: the wide size variation required in pet apparel due to breed diversity. ↩
-
"(PDF) Production planning and control in textile industry: A case study", https://www.academia.edu/12540295/Production_planning_and_control_in_textile_industry_A_case_study. Textile manufacturing operations typically employ batch production scheduling to optimize equipment utilization and minimize setup costs, with production calendars planned in advance to consolidate similar orders, though scheduling flexibility varies by mill capacity and customer relationships. Evidence role: general_support; source type: other. Supports: batch production scheduling practices in textile manufacturing. ↩
-
"(PDF) Complete Textile Wet-Processing – Academia.edu", https://www.academia.edu/7492234/Complete_Textile_Wet_Processing. Textile processing literature indicates that dyeing operations involve multiple sequential steps including preparation, dye application, fixation, washing, drying, and quality verification, with total processing time varying based on fabric type, dye method, and quality requirements. Evidence role: mechanism; source type: research. Supports: typical duration of textile dyeing and finishing processes. Scope note: Processing times vary significantly based on specific dyeing technology, fabric composition, and facility capabilities ↩
-
"Evaluating sewing operation complexity and its influence on … – PMC", https://pmc.ncbi.nlm.nih.gov/articles/PMC10006435/. Manufacturing efficiency research documents that operators performing repetitive assembly tasks experience a learning curve period during which speed and accuracy improve, with efficiency gains typically occurring over the initial portion of a production run as workers develop task familiarity and rhythm. Evidence role: mechanism; source type: research. Supports: the learning curve effect in repetitive manufacturing tasks. Scope note: Specific ramp-up quantities vary based on task complexity, operator experience, and product design ↩
-
"[PDF] Dirty Threads, Dangerous Factories – UCLA Labor Center", https://www.labor.ucla.edu/wp-content/uploads/2016/11/DirtyThreads_FINAL_web_single.pdf. Quality management research demonstrates that reducing inspection checkpoints or compressing quality assurance timelines typically results in higher defect rates reaching customers, as early-stage defects propagate through production without correction opportunities. Evidence role: mechanism; source type: research. Supports: the relationship between quality control rigor and defect detection rates. Scope note: Specific defect rate increases depend on product complexity, process maturity, and type of defects ↩
-
"Guide to SKU Rationalization: Here’s How to Get it Right – Extensiv", https://www.extensiv.com/blog/sku-rationalization. Inventory management literature supports concentrating purchasing volume on proven high-performing SKUs to optimize cash flow, reduce per-unit costs through volume discounts, and minimize stockout risk for predictable demand, while maintaining limited investment in experimental products. Evidence role: expert_consensus; source type: education. Supports: inventory concentration strategies for products with established demand. Scope note: Optimal concentration levels depend on demand variability, supplier reliability, and market competitiveness ↩
-
"E‑commerce Profit Margin Calculator – Estimate Your Online …", https://ecommerceprofitmargincalculator.com/. E-commerce business analysis indicates that online retailers must account for multiple cost layers including platform fees, payment processing, shipping, and returns when calculating gross margins, with actual margins varying based on pricing strategy, fulfillment method, and platform choice. Evidence role: general_support; source type: other. Supports: typical cost structures and margin calculations for e-commerce pet product sellers. Scope note: Specific margin outcomes depend on individual business arrangements, shipping strategies, and return rates ↩