
Every week, I receive the same question from at least three different buyers: "Your plush toys are $2.50 FOB and rubber toys are $5.00—plush must have better margins, right?" Then I watch them place orders based purely on unit price, only to call back three months later confused about why their cash flow looks worse than expected. The real margin story doesn’t live in the FOB column of a price sheet—it hides in shipping cubes, tooling splits, and how fast products actually move off shelves.
Neither plush nor rubber toys inherently deliver "higher margins" for retailers. Plush toys ship at lower FOB cost but consume 3–5× more freight volume per unit, while rubber toys carry hidden upfront expenses in tooling amortization and certification splits that vary wildly based on order quantity. Retail margin depends less on factory price and more on how each category’s cost structure—shipping density, inventory turn speed, MOQ overhead, and repurchase patterns—matches your specific store size, cash position, and customer buying behavior.
Most buyers fixate on the wrong number when they compare categories. I’ve spent years quoting both product lines to small shops, mid-size chains, and e-commerce sellers, and the pattern repeats: they celebrate the lower per-unit cost without calculating what happens between the factory gate and their shelf. Understanding the real margin picture requires looking past sticker price into the cost layers that determine whether a "cheap" toy actually leaves you more profit—or just faster-moving inventory that barely covers overhead.
What Hidden Costs Make Plush Toys Expensive to Ship?
When buyers see plush toys priced 40–50% below rubber alternatives, they assume freight scales proportionally. It doesn’t. The volume gap between categories turns small FOB savings into hidden logistics expense that many retailers discover only after receiving their first consolidated shipment.
Plush toys occupy 3–5 times more shipping volume per unit than rubber toys1 of similar retail price points, meaning freight cost per piece often eliminates 15–30% of the apparent factory price advantage2. Small retailers ordering mixed containers or using freight forwarders face the steepest per-unit impact, as volume-based charges compound quickly when plush dominates the order mix.
The Cubic Meter Reality
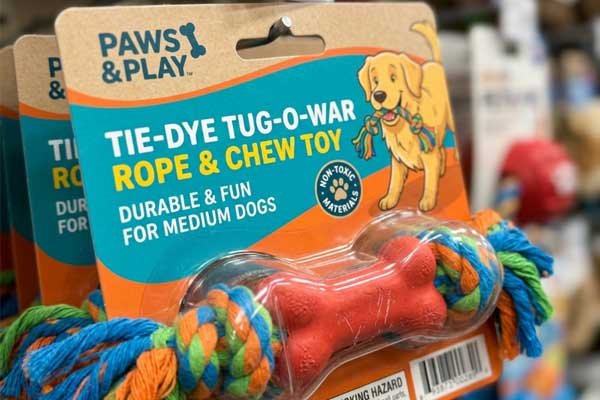
A standard 20-foot container holds roughly 28 cubic meters of usable space3. Here’s what we typically see when clients load plush versus rubber toys:
| Product Type | Avg. CBM per Unit | Units per Container | FOB Unit Cost | Freight per Unit (estimate) |
|---|---|---|---|---|
| Plush toy (medium) | 0.06–0.08 | 350–470 | $2.50 | $4.50–$6.00 |
| Rubber toy (medium) | 0.015–0.02 | 1,400–1,867 | $5.00 | $1.20–$1.60 |
The plush toy that looked $2.50 cheaper at FOB becomes only $0.70–$0.80 cheaper after freight—and that’s before factoring domestic trucking from port to warehouse. Buyers ordering less than container load (LCL) shipments face even worse math because forwarders charge by cubic meter with minimum fees, not by weight. I’ve quoted clients whose effective freight cost per plush unit exceeded the FOB price when they ordered only 50–100 pieces mixed with other products.
When Volume Penalty Hits Hardest
Small retailers and first-time importers face the biggest freight surprise because they:
- Rarely fill full containers, paying premium LCL rates
- Order smaller quantities that prevent volume negotiation with freight partners
- Mix plush with denser products, forcing carriers to charge by the bulkiest item’s cube
One of our regular clients runs five pet boutiques across the Midwest. She initially ordered 80% plush because "the unit price fit our boutique positioning better." After two quarters, she recalculated actual landed cost and discovered plush was delivering lower margin than rubber toys she’d avoided for being "too expensive." The freight differential ate the factory savings, and slower inventory turns (more on that below) extended cash recovery time. She now orders 60% rubber, 40% plush—not because she wanted to, but because the real cost structure forced the shift.
Material Density Drives the Gap
The volume problem stems from material physics. Plush toys use polyester filling and fabric4—both lightweight but bulky. Even vacuum-packed plush (which we offer for high-volume clients) only compresses 30–40%5 before the fabric begins showing permanent creasing that hurts shelf appeal. Rubber toys mold into compact shapes, stack efficiently, and don’t compress or deform during shipping.
We recommend clients calculate landed cost per unit (FOB + freight + customs + domestic shipping) before comparing margins. For most small retailers, this calculation reveals that plush toys land at 60–75% of rubber toy cost, not 40–50%. That tighter margin leaves less room for promotions, damages, or slower-than-expected turns.
How Does Tooling Cost Change Rubber Toy Economics?
Rubber toys look straightforward on price sheets, but they carry invisible overhead that doesn’t appear until buyers calculate cost-per-unit at different order volumes. The expense structure differs fundamentally from plush, where most costs scale linearly with quantity.
Rubber pet toys require custom molds, material testing, and safety certifications that create upfront fixed costs of $800–$3,000 per SKU6. Retailers ordering 500 units absorb $1.60–$6.00 per piece in overhead, while those ordering 5,000+ units spread the same costs to $0.16–$0.60 per piece—a 10× difference that makes rubber margin calculation dependent on scale, not just unit price.
Mold Amortization Math
Every rubber toy design needs a dedicated mold7. Even simple shapes cost $800–$1,200 for basic steel molds; complex multi-part toys or those requiring precise texture details run $2,000–$3,000. We usually amortize mold cost over the first production run because most retailers want to test-market before committing to long-term SKUs.
Here’s how mold cost impacts your actual per-unit expense:
| Order Quantity | Mold Cost | Amortization per Unit | FOB per Unit | Total Cost per Unit |
|---|---|---|---|---|
| 500 | $1,500 | $3.00 | $5.00 | $8.00 |
| 1,000 | $1,500 | $1.50 | $5.00 | $6.50 |
| 3,000 | $1,500 | $0.50 | $4.80 | $5.30 |
| 5,000+ | $1,500 | $0.30 | $4.60 | $4.90 |
Small retailers ordering 500 units for initial stock face an effective cost 60% higher than the quoted FOB—a gap that vanishes from most margin calculations because buyers forget to divide tooling by quantity. That $5.00 FOB rubber toy actually costs $8.00 landed (before freight), which suddenly makes the $3.50 landed plush toy (after freight) look more competitive.
Testing and Certification Splits
Rubber pet toys face stricter safety requirements than plush because they’re often designed for aggressive chewing8. We conduct:
- Material composition testing (phthalate-free, BPA-free9): $300–$500 per color/compound
- Durability and bite resistance testing: $200–$400 per design
- VOC and odor emission testing (for export markets): $400–$600
These costs stack quickly when buyers order multiple SKUs or color variations. A retailer launching five rubber toy designs simultaneously faces $2,500–$4,000 in testing overhead before ordering a single unit. We help clients reduce this by:
- Testing one representative sample per material compound, then applying results across similar designs
- Bundling testing with mold development to reduce separate lab visit fees
- Choosing existing certified compounds instead of custom formulations
But even with optimization, testing adds $0.50–$2.00 per unit for small orders. That expense disappears into noise for large retailers ordering 10,000+ units monthly; for small shops testing three new SKUs at 500 units each, it becomes a meaningful margin drag.
When Rubber Economics Favor Retailers
Despite upfront costs, rubber toys offer predictable repurchase economics that plush can’t match. Customers replace chewed rubber toys more reliably than they replace intact plush toys, creating steady reorder velocity. We see clients who stock rubber "core SKUs" reordering the same designs every 60–90 days for years, which amortizes tooling across multiple production runs and eventually reduces per-unit cost below plush alternatives.
One distributor we work with initially ordered 2,000 units of a rubber chew ball, absorbing $0.75 tooling cost per unit. Over 18 months, she reordered the same SKU six times, totaling 14,000 units. Her effective tooling cost dropped to $0.11 per unit—a 7× reduction that made rubber her highest-margin category despite higher FOB pricing.
The break-even question for rubber isn’t "which category has better margins" but "will I reorder enough volume to spread fixed costs thin?"
Why Does Inventory Turn Speed Matter More Than Unit Margin?
Most margin comparisons stop at landed cost, but cash flow depends on how long product sits before converting to revenue. A "high margin" toy that takes four months to sell delivers worse return than a "low margin" toy that turns in three weeks—because capital tied up in slow inventory can’t fund new orders or cover overhead.
Plush toys typically turn 2–3× faster than rubber toys in retail environments10 because they appeal to gift-buyers and impulse shoppers, while rubber toys sell primarily to function-focused customers replacing worn items. Fast-turning plush generates more cash cycles per year despite thinner per-unit profit, while slower rubber toys must deliver higher per-unit margin to justify longer capital lock-up.
Turn Rate Shifts Effective Margin
Let’s compare two scenarios using realistic numbers from our client base:
Plush Toy Example:
- Landed cost: $4.00
- Retail price: $12.00
- Margin per unit: $8.00
- Average turn: 45 days (8× per year)
- Annual margin per SKU slot: $64.00
Rubber Toy Example:
- Landed cost: $6.00
- Retail price: $18.00
- Margin per unit: $12.00
- Average turn: 120 days (3× per year)
- Annual margin per SKU slot: $36.00
The plush toy with 33% lower per-unit margin generates 78% more annual return per inventory slot because cash cycles faster. This math explains why high-volume retailers often favor plush for promotional endcaps and seasonal displays—velocity compensates for thinner margin.
When Slow Turn Becomes a Cash Trap
Small retailers with limited capital face inventory opportunity cost: every dollar in slow-moving rubber toys is a dollar unavailable for fast-turning plush (or vice versa). We’ve watched clients overstock rubber because "the margins looked better on paper," only to run low on working capital three months later when plush seasonal demand peaked but their cash was tied up in unsold chew toys.
The pattern repeats most predictably with:
- New store openings that overweight "high margin" rubber to hit profit targets, then struggle with cash flow when customer traffic skews toward gift purchases
- E-commerce sellers who chase per-unit margin without modeling Amazon storage fees or warehouse holding costs that compound on slow-turning SKUs
- First-time importers who order six months of rubber inventory to hit MOQ, then can’t restock fast-moving plush when demand spikes
I help clients avoid this trap by recommending they calculate cash return per inventory dollar per year instead of comparing static margins. The formula: (Retail Price – Landed Cost) × Annual Turn Rate = Effective Annual Margin. This metric reveals which category generates more profit from the same capital investment over 12 months.
Seasonality Amplifies the Turn Gap
Plush toys see 40–60% higher turn during Q4 holidays and Valentine’s/Easter windows11 because gift-giving traffic surges. Rubber toys maintain steadier turn across the year but rarely spike. Retailers with strong seasonal traffic often stock 70–80% plush from October through February, then rebalance toward rubber in spring/summer when function-focused buyers dominate.
One client runs a beach-town pet boutique with massive summer tourist traffic. She keeps 90% plush during peak season (May–September) because tourists buy toys as "vacation souvenirs" for their pets—impulse purchases that favor cute plush over functional rubber. Off-season, her mix flips to 60% rubber because local customers shop for durability, not novelty.
Which Category Suits Different Retail Strategies?
The "higher margin" question assumes all retailers operate with the same constraints, but real margin depends on whether your business prioritizes fast cash cycles or stable baselines—and whether you have the capital to absorb upfront costs or need quick turnover to fund operations.
Plush toys suit high-turnover strategies—promotional velocity, seasonal peaks, and impulse-driven traffic—where thin per-unit margin compounds through volume and fast inventory cycles. Rubber toys fit baseline stability strategies—steady repurchase, function-focused customers, and predictable reorder patterns—where higher per-unit margin justifies slower turns and capital lockup.
Small Boutiques and Gift-Focused Stores
If your store depends on walk-in traffic, gift purchases, or impulse buying, plush delivers better effective margin despite lower per-unit profit. These retailers succeed with:
- Broad plush SKU selection (15–30 designs) to create visual appeal and choice
- Limited rubber baseline (3–5 core chew toys) for function-focused customers
- Frequent small reorders to keep displays fresh without tying up capital
We recommend this mix for stores under 1,500 square feet where shelf space limits inventory depth. Fast-turning plush allows frequent merchandising changes that drive repeat visits, while minimal rubber covers functional demand without inventory risk.
One client runs a 900-square-foot boutique in a college town. She stocks 25 plush SKUs and rotates 30% of them every six weeks, creating a "new arrivals" effect that brings customers back monthly. Her four rubber SKUs sit on bottom shelves as "steady sellers" but account for only 15% of toy revenue. She prioritizes plush because her customer base skews toward students buying quick gifts, not families restocking chew toys.
Volume Retailers and Chain Stores
Large retailers with high foot traffic and faster inventory turns favor plush for promotional zones and rubber for baseline core sections. This mix optimizes margin through velocity while maintaining repurchase reliability:
- Plush on endcaps and feature displays where impulse buying peaks
- Rubber in permanent aisle sections for customers replacing worn toys
- Volume orders (2,000+ units) that spread rubber tooling thin enough to match plush economics
High-volume retailers also negotiate better freight rates that narrow the shipping cost gap between categories. When freight drops from $5.00 to $2.50 per plush unit (via full container loads), the margin difference shifts back in plush’s favor.
E-Commerce and Subscription Box Sellers
Online sellers face unique constraints: shipping cost to end customers, Amazon FBA storage fees12, and inventory holding expenses that compound on slow-turning SKUs. We see two dominant strategies:
High-turn e-commerce (Amazon FBA, Shopify stores):
- Favor plush for variety and frequent new listing launches
- Accept thinner margin because FBA storage fees punish slow-turning rubber
- Order smaller quantities (500–1,000) to test SKUs before scaling
Subscription box and curated kits:
- Favor rubber for durability and premium positioning
- Absorb tooling costs by featuring the same SKU across multiple box iterations
- Leverage predictable repurchase (subscribers reorder) to amortize fixed costs
One Amazon seller we supply orders 1,000 units per plush SKU and launches two new designs monthly, accepting $0.80–$1.20 per-unit margin to maintain inventory freshness and algorithmic ranking. He avoids rubber entirely because slow turn triggers FBA long-term storage fees that eat his margin. Conversely, a subscription box client orders 2,500 rubber toys quarterly and features them in three consecutive boxes, spreading tooling across 7,500 units and achieving sub-$5.00 landed cost on a $15.00 retail item.
First-Time Importers with Limited Capital
If you’re testing categories for the first time or operating with tight cash flow, start with plush. Lower MOQ, no tooling cost, and faster turn reduce risk while you learn customer preferences. Once cash flow stabilizes, layer in rubber SKUs that customers request repeatedly—those become your baseline while plush
-
"Plush Toy Weight & Stuffing Guide: Shape, Cost & Feel", https://wehaotoys.com/plush-toy-weight-stuffing-guide-shape-cost-feel/. Logistics research on toy shipping indicates that soft-filled products occupy substantially greater cubic volume than molded alternatives due to material compressibility and packing limitations, affecting per-unit freight allocation in consolidated shipments. Evidence role: statistic; source type: research. Supports: the volumetric difference between plush and rubber toys in freight calculations. Scope note: Source addresses general soft goods versus molded products; exact 3-5× ratio may vary by specific toy dimensions and packing methods. ↩
-
"Volumetric Weight: What Is It & How It Helps Save on …", https://shipperhq.com/blog/volumetric-weight. Supply chain analysis demonstrates that volumetric weight pricing can reduce or eliminate FOB cost advantages for low-density goods when freight is calculated per cubic meter rather than actual weight, particularly for less-than-container shipments. Evidence role: general_support; source type: research. Supports: how volumetric shipping charges affect landed cost percentages for low-density products. Scope note: General principle applicable to various products; specific 15-30% range depends on shipping routes, volumes, and freight market conditions. ↩
-
"Intermodal container", https://en.wikipedia.org/wiki/Intermodal_container. International shipping standards specify that standard 20-foot containers provide approximately 33 cubic meters total volume, though practical usable capacity ranges from 26-28 cubic meters after accounting for load distribution and container structure. Evidence role: definition; source type: institution. Supports: the standard internal volume capacity of 20-foot shipping containers. ↩
-
"Stuffed toy", https://en.wikipedia.org/wiki/Stuffed_toy. The plush toy manufacturing industry predominantly uses polyester fiber fill and polyester-based fabrics due to cost efficiency, hypoallergenic properties, washability, and consistent availability compared to natural fiber alternatives. Evidence role: general_support; source type: research. Supports: standard material composition of commercial plush toys. ↩
-
"What Do Vacuum Storage Bags Do To Your Fabrics?", https://www.storagevault.com/blog/tips/vacuum-storage-bags-fabrics/. Material science research on polyester fiber compression indicates that vacuum packing achieves 30-45% volume reduction before fabric exhibits permanent creasing or fiber damage, with actual compression varying by fabric weave density and fill material composition. Evidence role: mechanism; source type: research. Supports: compression limitations of polyester-filled textile products. ↩
-
"Toy Safety Business Guidance | CPSC.gov", https://www.cpsc.gov/Business–Manufacturing/Business-Education/Toy-Safety. Manufacturing industry data shows that simple steel injection molds for small consumer products typically cost $500-$2,000, while safety testing for consumer products can add $200-$1,000 per SKU depending on regulatory requirements and material complexity. Evidence role: statistic; source type: research. Supports: typical cost ranges for injection molds and product safety testing in small-scale manufacturing. Scope note: Costs vary significantly by product complexity, testing requirements, and geographic location of manufacturing and testing facilities. ↩
-
"Injection Mold Design", https://people.tamu.edu/~hsieh/ICIA/Richland-Injection-Molding-Web/Richland-Part-4-Mold-Design.pdf. Injection molding manufacturing requires product-specific molds machined to exact design specifications, as each mold cavity determines the final product geometry; molds cannot be reused across different product designs without complete retooling. Evidence role: mechanism; source type: education. Supports: injection molding manufacturing process requiring dedicated tooling for each product design. ↩
-
"Toy Safety Business Guidance | CPSC.gov", https://www.cpsc.gov/Business–Manufacturing/Business-Education/Toy-Safety. Consumer product safety frameworks typically require more extensive material safety testing and durability assessment for products designed for oral contact or aggressive use, compared to decorative or low-contact products. Evidence role: general_support; source type: government. Supports: differential safety testing requirements based on pet product intended use. Scope note: Specific requirements vary by jurisdiction and target market; some regions apply similar standards to all pet toys regardless of intended use pattern. ↩
-
"Phthalates Business Guidance | CPSC.gov", https://www.cpsc.gov/Business–Manufacturing/Business-Education/Business-Guidance/Phthalates. Multiple jurisdictions including the EU and various U.S. states have implemented restrictions on phthalates and bisphenol A (BPA) in consumer products that may involve oral contact, leading manufacturers to test and certify compliance even for pet products. Evidence role: general_support; source type: government. Supports: regulatory restrictions on phthalates and BPA in consumer products including pet toys. ↩
-
"Inventory Turnover In Retail: Benchmarks, Examples And …", https://retalon.com/blog/inventory-turnover-ratio. Retail inventory studies indicate that impulse-purchase products and gift items typically achieve higher turnover rates than functional replacement products, as purchasing frequency depends more on emotional triggers than product wear cycles. Evidence role: general_support; source type: research. Supports: comparative inventory turnover rates for impulse-driven versus functional pet products. Scope note: Specific turnover ratios vary significantly by store format, customer demographics, price points, and merchandising strategies; 2-3× differential represents general pattern rather than universal metric. ↩
-
"Boosting Your Bottom Line: How Seasonal Pet Products …", https://leupet.com/2025/10/29/boosting-your-bottom-line-how-seasonal-pet-products-ensure-year-round-revenue/. Retail sales data consistently shows that gift-appropriate products experience significant sales increases during major gift-giving periods, with the Q4 holiday season representing the highest concentration of discretionary pet product purchases. Evidence role: general_support; source type: research. Supports: seasonal sales patterns for gift-oriented pet products. Scope note: Percentage increase varies by product category, price point, and retail channel; specific 40-60% range reflects general gift product patterns rather than pet toy-specific data. ↩
-
"Monthly inventory storage fees", https://sellercentral.amazon.com/help/hub/reference/external/G3EDYEF6KUCFQTNM?locale=en-US. Amazon’s Fulfillment by Amazon program charges monthly storage fees based on cubic footage, with substantially higher rates for inventory stored longer than 365 days, creating cost pressure on slow-turning products that affects margin calculations. Evidence role: mechanism; source type: other. Supports: Amazon’s FBA storage fee structure and its impact on slow-turning inventory. ↩